How to track digital catalog performance comes down to four layers—reach, engagement, product interaction and revenue. Set one objective for each edition, use consistent tracking links, connect catalog events to GA4 and order data, and build a baseline from your own results. For ROI, include the full cost of the edition and the revenue it can reasonably be linked to. Use holdout groups when you need to test whether the catalog created lift.
Every marketing team knows the meeting. The new edition is on the screen, the photography is clean, the grid holds from cover to close, and everyone in the room agrees that it went well. Then someone from finance asks a simple question about what it earned, and the room goes quiet. The silence is rarely a verdict on the work. It is a verdict on the wiring, or the absence of it.
That silence is expensive. When budgets tighten, the first line cut is seldom the weakest performer. It is the one that cannot describe itself in numbers. A catalog that moved thousands of readers through a considered buying journey will lose its funding to a paid campaign with a worse outcome and a better dashboard. Learning how to track digital catalog performance is therefore less a matter of analytics fashion and more a matter of protecting good work from an argument it never gets to join.
This guide is for teams that already publish a digital catalog and want to measure what it contributes, from reader activity through to revenue and return on investment. You will learn how to connect those signals, decide which numbers matter, and build a measurement system you can use to judge each edition and improve the next one.
Keep reading!
How to track digital catalog performance
How to track digital catalog performance becomes much easier when the measurement is built in a fixed sequence, from the objective through reader activity, product interaction, revenue, and ROI. Each step depends on the one before it, so skipping ahead can leave gaps that are difficult to fix when the report is due.
The eight steps below show what to set up and connect before the next edition goes live.
Let's start with what needs to be measured.
1. Define one primary objective for the edition
Direct revenue, qualified enquiries, category education or reactivation of dormant buyers. Choose one, and allow no more than two secondary objectives. The objective gives the rest of the measurement a job. If the edition is meant to drive revenue, the report should eventually show whether catalog activity led to sales, not simply whether readers opened it.
2. Agree a naming convention before anything is published
Editions, versions, and audience segments each need a fixed identifier, written down and shared. These identifiers follow the catalog through links, events, and reports, making it possible to separate one edition from another. Changing a campaign name mid-flight can break comparisons and make it harder to see whether performance has improved.
3. Build the UTM plan
Use one source for each traffic origin, one medium for the catalog itself, one campaign for each edition, and content for the specific placement or version. The convention in the table below gives every visit a consistent label, so traffic from the catalog can be separated and compared later.
4. Configure the catalog events
At minimum, track catalog opens, page views or page turns, product clicks, image zooms, and outbound product links. These events show what readers do after entering the catalog, from browsing through product interest to the point where they leave for the next step. Revenue still needs to be connected through ecommerce or order data.
5. Tag every product link with its SKU
This is the join that lets page-level engagement meet sales data. When each product link carries the correct SKU, you can see which products received attention and whether that activity later connects with orders. The link is only as reliable as the product records behind it, so consistent identifiers and a single source of truth are essential.
6. Connect catalog sessions to revenue
Use ecommerce tracking, a shared promotion code, or an order source field captured at checkout. This is where performance moves from reader activity to business results. Without the connection, you can report clicks, views, and product interest, but you cannot clearly show how catalog activity contributed to revenue.
7. Build the dashboard once, on a single page
Freeze the metric definitions inside it. Keep the same core measures, filters, and naming across editions so one report can be compared with the next. A dashboard that changes its definitions every month makes a trend difficult to read. Consistent reporting shows whether the catalog is improving, holding steady, or losing response.
8. Set the review cadence
Review weekly while an edition is live, monthly between editions, and again after the relevant purchase cycle closes. The timing matters because an early report may show browsing while later data shows enquiries or orders. Reviewing the numbers at each stage helps separate immediate engagement from the performance that ultimately matters to the business.
UTM Convention for Catalog Campaigns
UTM field
Convention
Example values
Utm_source
The traffic origin, written in lowercase with no spaces
Email, Instagram, QR print, sales team
Utm_medium
The channel type, kept consistent so catalog traffic can be isolated
Catalog
Utm_campaign
The edition identifier, including season and year
Catalog_aw26
Utm_content
The specific placement, creative, or version
Cover_qr, page12_cta, version_b
Utm_term
An optional segment or keyword field when your reporting setup uses it
Houselist, prospect
The UTM structure answers a simple question: where did this catalog visit come from? Keeping the naming consistent lets you compare sources, placements, and editions instead of combining them into one traffic number.
MINIMUM EVENT SET TO CONFIGURE
Event
Fires when
Key parameters
What it helps measure
Catalog_open
A reader opens the catalog
Edition_id, source
Catalog reach and sessions
Page_turn
A reader moves to another page or spread
Edition_id, page_number
Browsing and engagement depth
Product_click
A reader clicks a product hotspot or link
Sku, page_number
Product interest
Image_zoom
A reader enlarges a product image
Sku, page_number
Product-level engagement
Outbound_product
A reader leaves the catalog for a product or enquiry page
Sku, destination_url
Product journey toward conversion
These events create the basic trail from catalog entry to product interest to the next buying step. Once that trail is connected to order data, the business can move from asking whether people used the catalog to understand what that activity contributed to performance.
The 12 metrics worth reporting every month
The twelve metrics worth reporting every month cover the full path from catalog reach to engagement, product interaction, and revenue. Define them before pulling the numbers, so everyone is measuring the same thing. The set below gives you enough visibility across all four layers without turning the dashboard into a report nobody reads.
Metric
Layer
How to define it
What it tells you
1. Unique readers
Reach
Distinct users who opened the catalog at least once in the period
Actual audience size, separate from send volume
2. Sessions by source
Reach
Sessions grouped by utm_source for the edition campaign
Which channels carry the catalog and which underdeliver
3. Open to view rate
Reach
Catalog opens divided by delivered impressions or emails
Whether the invitation is working before the content is judged
4. Average pages viewed
Engagement
Total page views divided by unique readers
Whether readers browse or bounce at the cover
5. Completion depth
Engagement
Share of readers reaching the halfway page and the final page
Where attention collapses in the page order
6. Average time on catalog
Engagement
Mean active session duration, excluding idle tabs
Considered reading versus incidental clicks
7. Return reader rate
Engagement
Share of readers with two or more sessions in the period
Whether the edition earns a second visit before purchase
8. Product click rate
Product interaction
Product clicks divided by page views on pages carrying products
How persuasive the page layout and imagery are
9. Clicks by SKU
Product interaction
Outbound clicks grouped by product identifier
The assortment truth your sales report cannot see
10. Attributed revenue
Revenue
Order value from sessions tagged to the catalog campaign
The defensible floor of commercial contribution
11. Assisted revenue
Revenue
Order value where a catalog session appears earlier in the path
The discovery value last click reporting discards
12. Return on investment
Revenue
Total value minus total cost, divided by total cost
The one number the budget conversation actually needs
Two definitions deserve extra care because they are the ones most often quietly reinterpreted between meetings. Completion depth should be measured against a fixed page, not a percentage, so that a longer edition is not flattered by a shorter one. Attributed revenue should name its attribution window in the definition itself, because a thirty day window and a seven day window describe two different businesses.
How to calculate catalog ROI without flattering the result
How to calculate catalog ROI starts with using the full value generated and the full cost incurred. The formula is simple, but the result is only useful when neither side is inflated or hidden. The steps below show how to calculate it without making the return look better than it was.
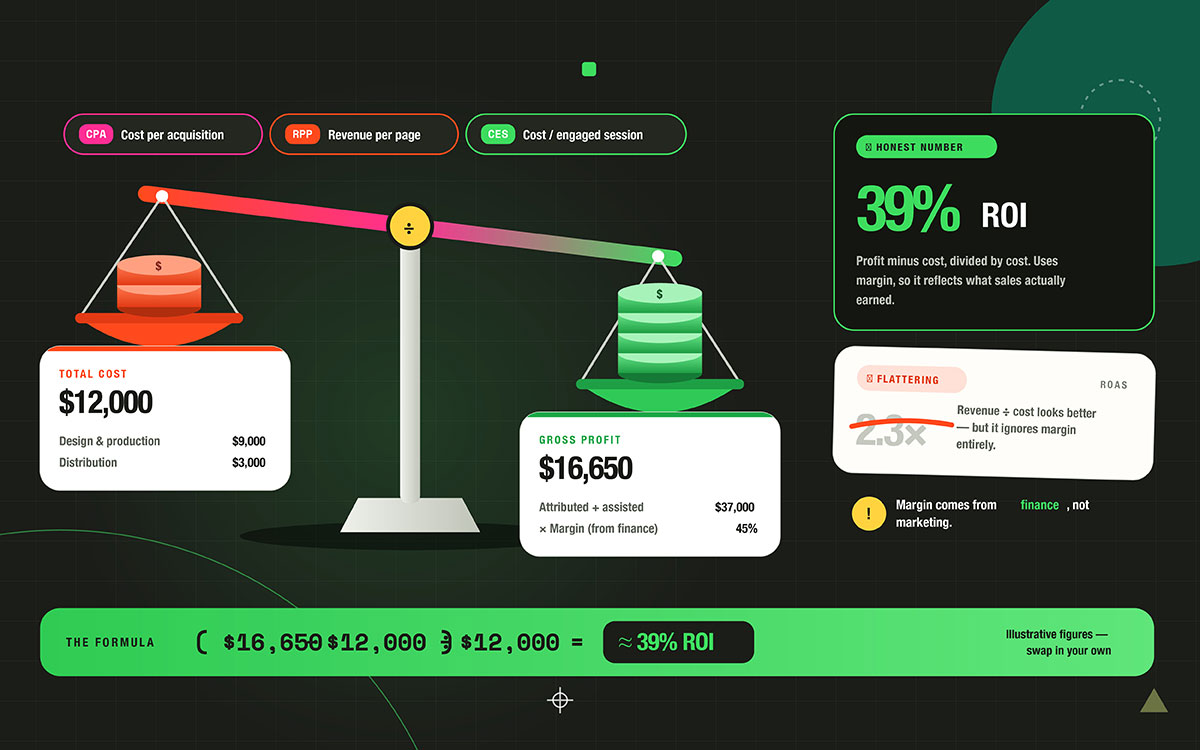
Return on investment: Value generated minus total cost, divided by total cost. Use gross profit where possible, so the return reflects what the sales actually earned.
Return on ad spend: Attributed revenue divided by catalog cost. It shows what the catalog brought in, but says nothing about how much profit was left.
Cost per acquisition: Total catalog cost divided by new customers acquired through catalog activity. This tells you what each new customer costs to win.
Revenue per page: Attributed revenue divided by page count. It shows whether the catalog is earning its space and helps inform catalog ideas for the next edition.
Cost per engaged session: Total catalog cost divided by sessions that meet your engagement threshold. It shows what you spent to generate meaningful browsing before a sale.
Well, the worked example below is illustrative. Every input is invented so you can follow the arithmetic and replace each figure with your own. One detail matters here: the margin should come from finance, not marketing. An optimistic margin assumption can make an honest report look much better than the business actually earned.
Line item
Illustrative value
Note
Design and production cost
$9,000
Design, photography, copywriting and build
Distribution cost
$3,000
Email, paid promotion, print and postage where applicable
Total cost
$12,000
Sum of the two lines above
Directly attributed revenue
$28,000
Orders from sessions tagged to the catalog campaign
Assisted revenue
$9,000
Orders where a catalog session appeared earlier in the path
Total attributed and assisted revenue
$37,000
The numerator, before margin is applied
Gross margin
45 percent
Supplied by finance, not estimated by marketing
Gross profit
$16,650
Total revenue multiplied by margin
Return on investment
Approximately 39 percent
Profit minus cost, divided by cost
Read the final line carefully. Gross profit of $16,650 minus total cost of $12,000 leaves $4,650. Divide that by $12,000 and the ROI is roughly 39%. The same edition would show a return on ad spend of 2.3 if you divided attributed revenue alone by cost. That number looks better because it ignores margin. Both figures can be reported, but they answer different questions.
The cost side deserves the same rigour as the revenue side. Design, photography, copywriting, retouching, build, proofing, and distribution all belong in the denominator. Internal time should also be included if your organisation tracks that cost. A structured cost breakdown makes the first budget easier to build, which is why this catalog design pricing guide can help when estimating the production side. Whatever figures you use, apply them consistently across editions so the comparison stays useful.
A note on published benchmarks
Published catalog benchmarks can be difficult to compare because sources may use different audiences, definitions, attribution methods, and cost calculations. Treat them as directional rather than as a target for your own business. Your first measured edition gives you a starting point, and consistent measurement across later editions gives you a more useful baseline for judging change.
How to track print alongside digital
Tracking print alongside digital requires different signals, but it can still show how the catalog contributes to customer response. Print cannot provide the same link-level data as digital, so the measurement needs to use trackable codes, URLs, response data, and sales records while being clear about what each signal can prove.
QR codes, one per major spread rather than one per book: A single code on the back cover tells you the catalog generated some response. A code by spread or category gives you a clearer view of which parts prompted action.
Personalised URLs for segmented mailings: These give you a clearer link between the recipient or segment and the resulting session, making it easier to connect printed mailings with later digital activity.
Unique promotion codes by version: These produce a clear revenue signal at checkout, and they can still capture the order when a reader types the web address manually rather than scanning.
Call tracking numbers where phone ordering still matters: If customers often order by phone, a unique number can connect those responses to the catalog. An untracked number leaves those orders out of the report.
Matched period traffic lift: Compare site traffic and branded search after delivery against a comparable prior period, while controlling for other campaigns, promotions, and seasonal changes in market.
State the caveat openly in every report. Coded response can undercount actual influence because a meaningful share of readers may see a printed page and later arrive through a channel that carries no code. Treat coded response as a measurable floor, not a complete record of every action influenced by the catalog.
When print and digital run together, the measurement should bring their different signals into the same performance view. Track each format using the method that fits how customers respond, then use the combined evidence to understand catalog performance and ROI.
Digital catalog performance FAQs
Digital catalog performance FAQs help answer the questions that come up when teams review the results of a catalog. The difficult part is often not finding a number, but knowing what that number actually tells you. The answers below explain the key measures in plain language, along with the conditions that can change how the results should be read.
Measure it across four layers rather than one number. Reach covers unique readers and sessions by source. Engagement covers pages viewed, completion depth, and time spent. Product interaction covers clicks, zooms, and saves grouped by SKU. Revenue covers attributed orders, assisted revenue, and ROI. Platform analytics supply the first three layers, while order data supplies the fourth.
Catalog ROI is calculated as total value generated minus total cost, divided by total cost, expressed as a percentage. Total cost can include design, photography, copywriting, build, distribution, and internal time where those costs are tracked. Total value should account for attributed and assisted revenue, then be converted to gross profit using the margin figure supplied by finance. Reporting revenue alone can overstate the return.
There is no universal conversion rate worth quoting. Results vary by category, price point, purchase cycle, traffic source, and audience. Published benchmarks can also reflect different definitions and measurement methods. A self-built baseline is more useful. Measure your first edition consistently, repeat the same method for later editions, and compare each result with your own history rather than a borrowed benchmark.
Yes. Use QR codes, personalised URLs, unique promotion codes, call tracking numbers, and matched period comparisons to capture responses after delivery. The caveat is that coded responses undercount influence because some readers act through untracked channels after seeing the catalog. Treat coded response as a measurable signal, not the full effect, and use a holdout group when you need to test incremental contribution.
GA4 or an equivalent analytics platform, a consistent UTM convention, your ecommerce or CRM system, and a spreadsheet can support the core measurement framework. Catalog platform analytics can add page-level activity, while heatmaps can provide further interaction detail where available. Neither is essential at the start. Consistent tagging and reliable order data matter more than adding another analytics tool.
Measure the catalog through at least one full purchase cycle, which may take several months for considered or high-value purchases. Judging an edition after two weeks can miss later orders and repeat visits. Three editions can provide a more useful comparison because one result may reflect seasonality, audience quality, or market conditions. Keep the measurement method consistent across editions.
Endnote
Finally, a digital catalog earns its place in the budget when you can explain what happened after someone opened it.
That does not mean counting every click and calling it ROI. A customer may browse a product today, return through another channel tomorrow, and buy later. The useful question is whether the catalog contributed to that decision, what it cost to produce that result, and whether the outcome was different from what would have happened without it. That is why consistent event tracking, a clear attribution model, complete cost reporting, and a holdout group matter.
Think about the next reporting meeting. Someone asks, “Did the catalog work?” You should not have to open five dashboards, explain three different definitions of a conversion, or discover that part of the campaign cost was never included. The answer should be sitting in one report, built from definitions everyone agreed on before launch. That is the practical value of knowing how to track digital catalog performance and roi.
Start with one objective and define the actions that support it. Keep the naming consistent, record the full cost, establish your baseline, and give the data enough time to show a pattern. Then use what you learn to decide what to change in the next edition. Measurement is not there to make every catalog look successful. It is there to show you what actually happened.
For the work behind that measured experience, Graphic Design Eye provides catalog design to organize the product range, page structure, and visual presentation so customers can browse and act on the catalog more easily. If your next edition is already on the calendar, explore the catalog design service and give the measurement plan a clear starting point.
Now you know what to measure! Go see what your catalog is actually doing!
Graphic Design Eye LLC is a full-service creative agency built for brands that demand more than design — they demand vision. From strategic branding to complete visual identity, we partner with startups, agencies, and growing businesses as a dedicated creative force. With flexible subscription and project-based models. Let's start with us today!