


Custom Infographic
Custom Infographic Design Service Engage Your Audiences
A custom infographic design service is able to bring the required engagement for your company or business. Because the blend of information and graphical visuals makes the content look far more attractive and authentic. We have several options including static, 3D, and animated infographic designs for our clients. Get started with us today!

Statistical infographic design

Comparison infographic design

Anatomical infographic design

Geographical infographic design

List-based infographic design

Visual Resume infographic design

Timeline infographic design

Hierarchical infographic design

Process infographic design
Statistical infographic design
Comparison infographic design
Anatomical infographic design
Geographical infographic design
List-based infographic design
Visual Resume infographic design
Timeline infographic design
Hierarchical infographic design
Process infographic design
Statistical infographic design
Comparison infographic design
Anatomical infographic design
Geographical infographic design
List-based infographic design
Visual Resume infographic design
Timeline infographic design
Hierarchical infographic design
Process infographic design
Proposal
Infographic Design Service
Infographic design service ensures the best comprehensible content you can get ever. In fact, using the infographic content, it becomes easier to reach the audience base.
Typically, the texts tell stories. But the application of visuals makes the stories more appealing. So, if you are promoting a brand, business or company, you can easily deploy infographic design. It can explain charts, diagrams, graphs or any other complex data easily to your audience. Thereby, storytelling, promotion design – all become effortless to invite success to your business.
What’s more, our expert infographic designers can streamline large concepts into a visual format. So, the design becomes a tool to break down complicated pieces of information. As a result, the audiences can absorb the content at a glance. Data analytics is also simple through our infographic design.
Business analysis is another feature of the best infographic design. You can showcase business trends, analyze them, explain ups and downs using visual formats. So, there are less alternatives to this graphic design technique.
Being a leader in providing the best infographic design service, we have a pool of experts. We can generate innovative infographic design ideas to cater to your requirements. So, contact us now or place your infographic design order by clicking the PLACE ORDER button!
5,400+
Happy Clients
24h
First Draft
4.9★
Avg. Rating
- Data visualization that makes complex simple
- Custom branded infographics for every channel
- Static, interactive & animated infographic formats
- Optimized for sharing across every platform
Your Next Step
Ready to Get Started?
Our custom infographic design start at $49
Delivery in 24 Hours
Unlimited Revisions
No Hidden Charges
2 Design Concepts
Infographic Type
Types Of Custom Infographic
Types Of Custom Infographic
Design For Business
Infographics can be of various forms. Initially, they are categorized based on-
Purposes Types of objects used Flow of information
There are various types of infographics design formats are available and there is no obstacle to choosing one of them to go with your work but be a mind that you need to choose the right one to fulfill your desire. Designing a specific type of infographics can influence your audience passively and it would drive them to think on your way.
According to your needs, we have categorized the infographics into some most-used types. Read all those categories carefully and make sure which one will suit your purpose.
Statistical Infographic Design
Statistical infographics are used to present survey results with graphs and charts, gather data from multiple sources to make an argument with relevant data, or present research and facts visually. You can share statistics or any other surveillance through this type of infographic. This type of infographic will help you to
Feature various data visualizations designed to simplify a complex topic Make complicated information easier to quickly understand Allows you to vary the data visualizations with charts, icons, and graphs.
Comparison Infographic Design
This type of infographic is very useful for comparing multiple objects, concepts, or topics. Mainly, it is a visual representation of-
Comparison of two or more companies, events, or time periods that are opposed to each other Comparison of two or more objects to get a better understanding of these It helps the teacher students to make compare any similar topics to get better knowledge about something This allows readers to quickly understand the important points and make a comparison in one second
Anatomical Infographic Design
To describe different parts of an object or to explain how something works, an anatomical infographic is the best option to go with. It is used for various purposes such as as-
To define human anatomy in the medical issue To give some facts about how something works on Describe the effects or benefits of any data
Geographical Infographic Design
Think you have a presentation on which you need to work with location-based data also you need to use maps of a different region, then you must choose this type of infographic. This type of infographic will allow you to-
Depend heavily on maps to visualize data Work with demographic data Simply point out locations on a map Compare data by region or demographic
List-Based Infographic Design
A list infographic is what contains a brief list of a subject. List infographic is useful in-
Educational purposes To give tips on what to do or not Product information in business
Visual Resume Infographic Design
The present job market is so complicated that it is too hard to apart one from the others. In the race of creativity, you should set yourself as different from others. When you are going to apply for a job, the first thing you need is a resume. Your resume should be different and unique to impress your employer. There is a proverb that goes that, the first impression is the last. That’s why infographic resumes gained a lot of favor in the present time. An Infographic resume is a great visual document to-
Bring to an interview Perfect to publish on your portfolio site Can include in an email option
Timeline Infographic Design
This type of infographic shows how a subject has developed or changed over time. In the modern world, people like to work with various types of data. People also like to know the history of something with dates and times. For this reason, the timeline infographic becomes a familiar option to work with different types of timeline history. Timeline infographic should be used to-
Explain the history of a topic How atopic changes overtime Visualizing the history of something To highlight important dates To give an overview of a previous event To demonstrate product development
Hierarchical Infographic Design
A hierarchical infographic is used to summarized information as to its predefined level. Generally, it features a pyramid to show different levels of information according to its importance. If you want to classify your information by different levels such as by greatest to least, by priority, worth, or difficulty you better go with this type of infographic. Many organizations use a hierarchical infographic to visualize the chain of command or to show how something is broken down into parts.
Process Infographic Design
Process infographics are the visual process of completing a task or showing the steps of a process. There are some processes that might be really difficult to express with a timeline infographic, while the process of the infographic is the best option to summarize or give an overview of the steps in the process. Sometimes process infographics use flowcharts or diagrams to clarify each step. Generally, it follows the flow of top-to-bottom or left-to-right to guide readers through processes. It also uses numbers to make the process easy to follow.
Infographic Package
Infographic design pricing
The best infographic design price varies based on factors like design complexity, addition of infographics, design layouts, and more. But we provide the best infographic design service price at a reasonable rate to our clients. The price begins from $49, while sky is the limit as the highest design ceiling. However, based on the work volume, quantity of designs, design variations, and number of revisions, we offer a flat rate to our clients.
Basic
$49
-
Up To 3 Infographic Data Points Design (Pies, Charts, Bars, etc.)
-
Get 2 Infographic Design Concepts to Choose From
-
Includes 2 Experienced Designer
-
Free Infographic Design Samples & Mockups
-
Custom Graphics & Size
-
Provide Free Photo Editing
-
Design in Languages: EN, DE, AR, ES & others
-
Editable & Digital Format: AI, EPS, JPG, PDF (Recommended Format)
-
Unlimited Revisions
-
Delivery Time 24 Hours
-
Full Copyright Transfer
-
No Hidden Charges
-
Money Back Guarantee
-
Client Satisfaction Guaranteed
-
File Backup 180 Days
-
24/7 Dedicated Manager
-
After Service Support
Advanced
$99
-
Up To 8 Infographic Data Points Design (Pies, Charts, Bars, etc.)
-
Get 3 Infographic Design Concepts to Choose From
-
Includes 3 Experienced Designer
-
Free Infographic Design Samples & Mockups
-
Custom Graphics & Size
-
Provide Free Photo Editing
-
Design in Languages: EN, DE, AR, ES & others
-
Editable & Digital Format: AI, EPS, JPG, PDF (Recommended Format)
-
Unlimited Revisions
-
Delivery Time 24 Hours
-
Full Copyright Transfer
-
No Hidden Charges
-
Money Back Guarantee
-
Client Satisfaction Guaranteed
-
File Backup 180 Days
-
24/7 Dedicated Manager
-
After Service Support
Most Popular
Most Popular
Executive
$199
-
Up To 15 Infographic Data Points Design (Pies, Charts, Bars, etc.)
-
Get 4 Infographic Design Concepts to Choose From
-
Includes 4 Experienced Designer
-
Free Infographic Design Samples & Mockups
-
Custom Graphics & Size
-
Provide Free Photo Editing
-
Design in Languages: EN, DE, AR, ES & others
-
Editable & Digital Format: AI, EPS, JPG, PDF (Recommended Format)
-
Unlimited Revisions
-
Delivery Time 48 Hours
-
Full Copyright Transfer
-
No Hidden Charges
-
Money Back Guarantee
-
Client Satisfaction Guaranteed
-
File Backup 180 Days
-
24/7 Dedicated Manager
-
After Service Support
Leading
$299
-
Up To 20 Infographic Data Points Design (Pies, Charts, Bars, etc.)
-
Get 6 Infographic Design Concepts to Choose From
-
Includes 6 Experienced Designer
-
Free Infographic Design Samples & Mockups
-
Custom Graphics & Size
-
Provide Free Photo Editing
-
Design in Languages: EN, DE, AR, ES & others
-
Editable & Digital Format: AI, EPS, JPG, PDF (Recommended Format)
-
Unlimited Revisions
-
Delivery Time 72 Hours
-
Full Copyright Transfer
-
No Hidden Charges
-
Money Back Guarantee
-
Client Satisfaction Guaranteed
-
File Backup 180 Days
-
24/7 Dedicated Manager
-
After Service Support
Not sure which infographic design package fits your content needs?
Get a customized infographic design package built around your data and audience or start a subscription for your ongoing content design needs.
Order Completion
How Our Infographic Design Process Works
Our infographic design process is straightforward, you provide the data and the story, we provide the visual intelligence to present it in the most compelling and accessible way possible.
Place Your Order & Share Your Data
1
Share your data, research, or information, along with your target audience, the key messages you want to communicate, your brand guidelines, and any specific format or dimension requirements for the platforms you plan to publish on.
Design, Review &
Refine
2
We design your infographic, structuring the information hierarchy, selecting the most appropriate visualization approach, and applying your brand identity throughout and share the design for your review and refinement.
Approve & Receive All Formats
3
Once approved, we deliver your infographic in every required format web-optimized PNG and JPG for digital use, print-ready PDF for physical applications, and any platform-specific size variants you need.
Got data that deserves a better presentation? We can help!
Testimonial
Thousands of Happy Clients, Countless Success Stories
We have designed infographics for technology companies and research institutions, for nonprofits and global brands, for publishers and marketing agencies, across every industry where complex information needs to be made accessible, engaging, and shareable for a specific audience.
4.9
99%
Client Satisfaction5,400+
Happy Clients
Great Service, they took in my ideas and responded quickly and accordingly.
Mauricio Guerra
Owner
Graphic Design Eye are a wonderful company to work with. They helped Africa Health Organisation (AHO) by designing its marketing...

Graciano Masauso
CEO
The design was totally outstanding! I couldn’t think you people bear such kinds of highly impressive designing thoughts. I...

Adrienne
Executive Director
Frequently Asked Questions
Infographic Design FAQs
Check some of the relevant infographic design FAQs. We have accommodated some of the necessary questions and answers to enrich your existing infographic design ideas. However, if you have any other questions related to infographic design services, feel free to ask on our contact page or send a direct email. We will get back to it as fast as possible.
UX infographics are the best method for any product with an interface including websites. Actually, UX design means user experience which is the process of building relationships between a company and its product and customers. It needs too much research to develop a company’s user experience design to satisfy its users. Designing a great User experience is hard. In this issue, infographics can be very helpful to visualize complex processes and conspectus relationships that will be difficult to express in other ways.
Some tips to make your infographic design great is given below-
Create your infographic for your target audience. Try to keep it as simple as you can. Focused on the topic you would like to share with your audience. A great infographic should be clear and shouldn’t be confused. Keep your graphics simple. tell your story in sections so it flows, don’t use too many colors. Make your infographic easily readable. At last, make your infographic shareable with social plugins and ask users to share it.
Today’s world, information is the most powerful weapon. At present, you need to work with various types of information. And that information should be present in an easier way for your audience.
Do you know more than 65% of people are visual learners?
In this situation, you must need an infographic design service to give your thought a visual form. Infographics are a subset of graphic design services. It is an innovative tool to present complex data points simply and understandably.
There is some point of view that you should consider when designing your infographic but basically, it costs all the way from 50 USD to 350 USD. So, if you need impactful infographics for any of your purposes, then you must need to contact an expert graphic design company who can realize you and can serve the best design according to your needs.
Are you a digital marketer or business consultant? Do you need to boost your marketing engagement through digital marketing or do you want to strengthen your argument in client proposals? Then infographics will help you a lot to guide your target audience to make them think like you. Besides, educators and trainers need it more because they have to explain difficult concepts or complex topics. Infographics make things easier and more understandable that one can quickly engage in any of the hard topics. Also, non-profit organizations use infographics to raise awareness of any social issues or to promote events for their causes. Governments use infographics to create public awareness in disaster situations or to share statistics and census of the population.
CASE STUDIES
See How Our Infographic Design Service
Transformed These Clients
We have designed infographics that went viral, that were picked up by major publications, and that became the most-shared piece of content a brand had ever produced. Our case studies show what happens when great data meets great design and the reach and authority that follows is exactly as significant as the quality of the content deserves.
")
How Better Design Improved Brand Performance

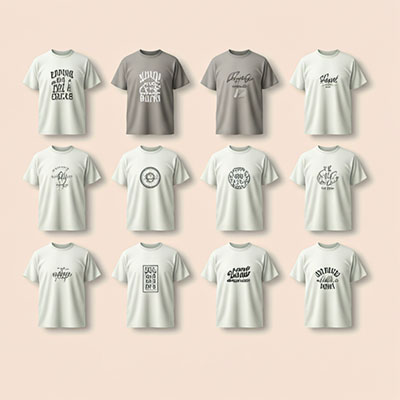
How Custom Merch Designs Increase Revenue for Printing Company

How Strategic Design Built a Premium T-Shirt Brand