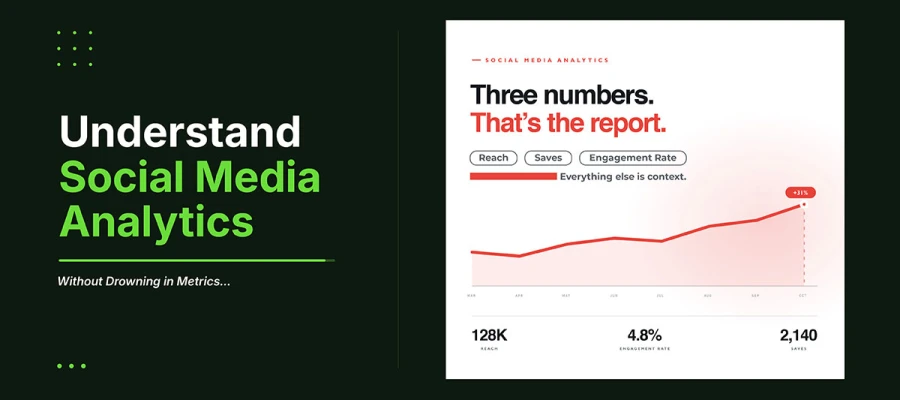
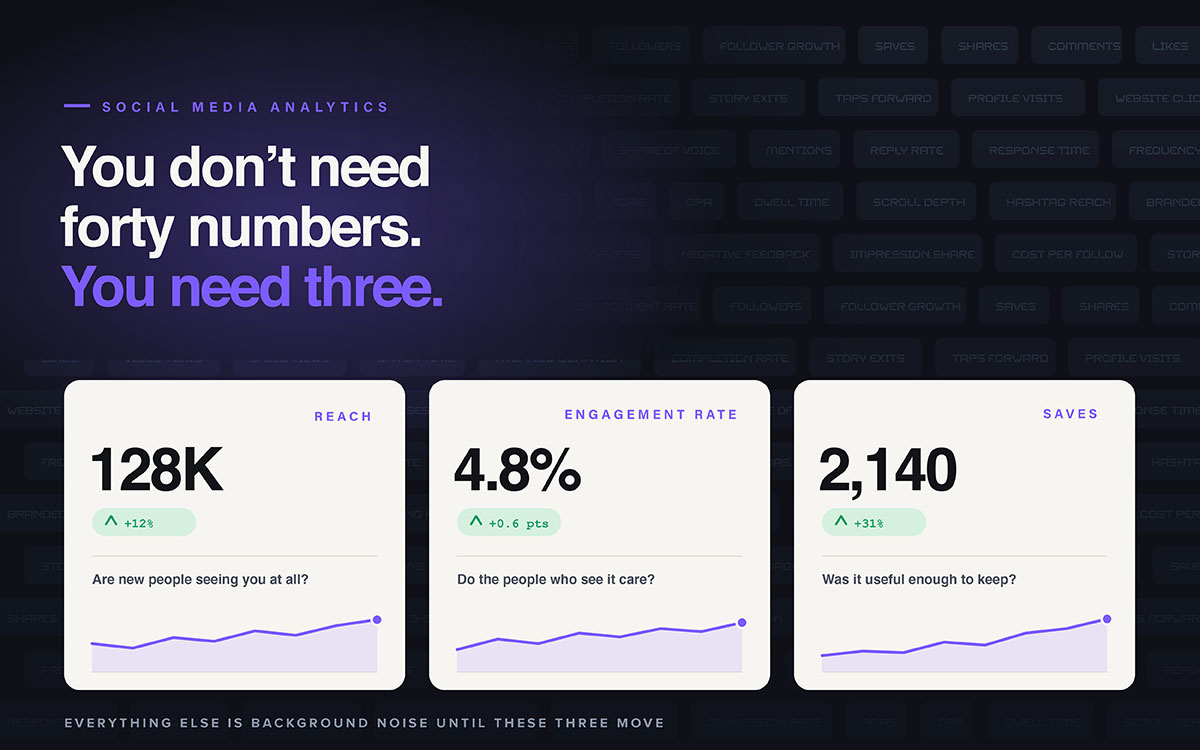
How to understand social media analytics when every number on the dashboard seems to be arguing with the others? Reach climbs while engagement drops. One post outperforms the rest by a factor of six for no clear reason. The short answer is that no single metric means anything by itself. Reach without engagement rate tells you nothing. Engagement without saves or shares tells you less. Understanding social media analytics is about learning which combinations of numbers answer which questions.
Most people treat the dashboard like a report card, a single score that tells them whether the work is going well. It is not that. It is a set of clues, and clues only mean something when you read them together.
That distinction changes everything about how the next fifteen minutes should be spent. Once you know which pairs of numbers to check, an entire monthly review shrinks from an overwhelming scroll into a short, decisive routine, one that tells you exactly what to make more of and what to stop.
This social media analytics guide covers all ten core metrics. It breaks down realistic benchmarks by platform. It explains why published benchmark reports disagree so wildly. And it turns all of it into a fifteen-minute process that ends in two honest sentences a month.
How to understand social media analytics
As you approach knowing how to understand social media analytics, it only tells the truth if you read it right. Each metric follows what it measures, what it really shows, what it misses, and how to read it well. It’ll let you avoid the mistakes that ruin most social media metrics explained.
Metric 1: Reach
What it measures: How many unique accounts saw your post at least once.
What it tells you: How far the content spread beyond your followers. If reach is much higher than your follower count, the algorithm pushed it to non-followers.
What it does not tell you: Whether people read it, liked it, or remembered it. Reach just confirms delivery. A delivered email isn't a read email.
How to read it: Compare reach to follower count. Reach at 20 percent of followers is normal. Reach at 200 percent means the post got pushed hard.
Metric 2: Impressions
What it measures: How many times your post was shown, counting repeat views by the same person.
What it tells you: How often people saw it. When impressions are much higher than reach, the same people are seeing it multiple times.
What it does not tell you: A bigger audience. Impressions can look high just because a few people saw the post over and over.
How to read it: Divide impressions by reach. A ratio above about 1.5 means repeated views, not real growth.
Metric 3: Engagement rate
What it measures: Total interactions divided by reach or followers, shown as a percentage.
What it tells you: Whether people liked the content they saw. It's the most useful metric on most platforms.
What it does not tell you: Business impact. Fun content can get high engagement but bring in no sales.
How to read it: Check if your platform uses reach or followers. The two give very different numbers. Don't compare them.
Metric 4: Saves and bookmarks
What it measures: How many people saved the post to revisit later.
What it tells you: Perceived future value. A save is the strongest organic sign that content felt truly useful, not just entertaining.
What it doesn't tell you: Immediate action. People often never revisit saved content. But the save still signals quality to the algorithm.
How to read it: Track saves separately from likes. Low likes with high saves means educational content is working well.
The practical result: Saves reward different content than likes do. Reference material, step-by-step guides, and anything worth finding again do well on saves but look weak on likes. Keep this in mind when judging social media post design ideas by the wrong measure.
Metric 5: Shares and sends
What it measures: How many people forwarded the post.
What it tells you: Social approval. Sharing puts the person's reputation behind your content. That's a bigger commitment than a like.
What it does not tell you: Wide reach. Most shares go to one person in a private message, not a public crowd.
How to read it: Shares best predict algorithm reach on most platforms. Treat them as your top quality signal.
Metric 6: Comments
What it measures: How many replies the post got.
What it tells you: How deeply people engaged and what they felt. Comments are the only common metric with real qualitative info.
What it does not tell you: Approval. Comments include criticism, confusion, and complaints too, not just praise. The count hides which.
How to read it: Actually read them. The number means little next to the content. Most teams just report the count and skip reading the replies.
Metric 7: Follower growth rate
What it measures: New followers as a percent of total, over time.
What it tells you: If the account is growing steadily. Percentages compare fairly across account sizes, unlike raw numbers.
What it does not tell you: Audience quality. A viral post often brings followers who don't care about the content.
How to read it: Check engagement alongside growth. If followers grow but engagement drops, the new audience isn't the right one.
Metric 8: Click-through rate
What it measures: Link clicks divided by impressions, shown as a percentage.
What it tells you: If the content sparked enough interest to pull someone off the platform. It's the clearest link between social activity and business results.
What it does not tell you: Purchase intent. A click just shows curiosity. Most clicks don't turn into sales.
How to read it: Compare click-through rate across post formats, not against a general benchmark. Your own baseline is the only comparison that matters.
Click-through rate is also easily swayed by factors unrelated to the post itself, such as offer strength, landing page speed, and whether the destination matches what was promised. That's why it's usually read alongside the rest of the digital marketing funnel, not as a verdict on the creative alone.
Metric 9: Referral traffic
What it measures: Website visits that came from social media, tracked in your analytics.
What it tells you: Real traffic to your own site. You measure this yourself, not the platform.
What it does not tell you: Credit. Someone sees a post, searches your brand later, then arrives through another channel that gets the credit.
How to read it: Add UTM tags to every social link. Without them, platform tracking is unreliable. It often undercounts social's real impact.
Metric 10: Video retention and average watch time
What it measures: How much of a video people watch, and when they stop.
What it tells you: Content quality, more precisely than any other metric. The drop-off curve shows the exact second people leave.
What it does not tell you: Total audience size. High retention on a video with only 40 views shows the format works, not that it reached people.
How to read it: Check the first three seconds. Most video failure happens there. The fix is almost always the opening frame.
The drop-off curve is the most useful diagnostic in social analytics. It names the exact moment attention was lost, instead of just reporting the loss. Most problems it shows can be fixed in editing. That makes it the metric that most directly shapes your next video editing.
Realistic engagement benchmarks by platform
Engagement benchmarks vary a lot by platform. Each one measures the rate differently. Instagram and Facebook compare against followers. LinkedIn and X often compare against impressions. YouTube looks at thumbnail click-through rate.
First, compare your results to your own past average. This is how to understand social media analytics. Comparing across platforms without matching methods can mislead you.
Platform
Typical 2026 Range
Calculated Against
Notes
Instagram
Around 1% to 2%
Followers
Format matters more than platform average. Reels and carousels run well above static images. Reach-based figures run several times higher and are not comparable.
Facebook
Around 0.1% to 0.2%
Followers
Organic reach is heavily limited. Very low rates are normal and are not a sign of failure.
LinkedIn
Around 3% to 4%
Impressions
Currently the highest of the major platforms. Calculated against impressions, so it is not comparable to follower-based figures.
X
Around 0.05% to 0.15%
Followers or impressions
Has declined sharply. High posting volume with low engagement per post is the normal pattern.
TikTok
Around 2% to 3%
Followers
Still among the highest, though down year on year. Figures based on views run differently again.
YouTube
Around 5% to 10% CTR
Thumbnail impressions
Varies significantly by niche and traffic source. Browse and suggested traffic behave differently from search.
Email
Around 20% to 35% open rate
Delivered emails
Included to show how much stronger owned channels remain relative to rented ones.
WHY PUBLISHED BENCHMARKS DISAGREE SO WILDLY
If you compare benchmark reports, you'll see numbers for the same platform that differ by ten times or more. Facebook averages have ranged from under 0.1 percent to several percent in the same year. Different 2026 studies put TikTok at both the top and bottom of the rankings.
Neither set is wrong. They measure different things. Engagement against followers, reach, or impressions gives three different numbers from the same activity. Study samples also differ by industry mix and account size.
It proves the article's main point. A benchmark needs a stated denominator, or it isn't a benchmark. Your own three-month average matters more than any published figure.
The fifteen-minute monthly review
The process of how to understand social media analytics takes just fifteen minutes. Spending more time rarely leads to better decisions. Rank your posts by engagement rate. Read comments on your best and worst posts. Check two simple ratios. Compare them to your own average. Then write two conclusions.
It's also the cheapest way to plan where production effort goes. That matters when comparing social media design costs to formats that actually earn their place.
Minutes 1 to 3: Rank by engagement rate, not by likes
Pick your top three and bottom three posts of the month. Rank them by engagement rate, not raw interactions. Raw counts just show which posts reached the most people. You already know that. Rate shows which content truly earned its audience.
Minutes 4 to 6: Read the comments on your best and worst post
Open the actual replies on one post from each end. Read them. This is the only qualitative data in the whole dashboard. It usually explains the numbers faster than more analysis ever could.
Minutes 7 to 9: Check two ratios
Reach divided by followers shows if the algorithm is spreading you past your own audience. Impressions divided by reach shows if the same people keep seeing you. Two simple math steps answer most distribution questions.
Minutes 10 to 12: Compare against your own trailing average
Compare this month to your own three-month average. Don't compare it to competitors or published benchmarks. One month is too random. Timing and algorithm changes affect it too much. It doesn't mean much on its own.
Minutes 13 to 15: Write two sentences and stop
Say one thing to do more. Say one thing to stop. If the month gave no clear answer, just say that. Don't make one up. An honest blank beats a fake insight. It will likely clear up next month.
Social media analytics FAQs
How to understand social media analytics question tends to surface at the same moment: dashboard open, decision pending, meeting in an hour. The answers below are direct first, reasoning second, so each one works as a standalone answer to the exact question asked. Together they cover reading metrics, benchmarks, tracking frequency, and proving results to stakeholders.
Read metrics together, not alone. One number rarely means much by itself. Start with reach and an engagement rate benchmark together. It’ll show if the problem is distribution or content. Then sort the rest into awareness, engagement, conversion, or community.
It depends on the platform and what you measure it against. As a rough 2026 guide, expect about 1 to 2 percent of followers on Instagram, 3 to 4 percent of impressions on LinkedIn, and 2 to 3 percent on TikTok. Compare to your own past average, not bigger accounts.
Reach is the number of unique accounts that saw your post at least once. Impressions are the total times it was shown, even to the same person twice. If impressions are much deeper than reach, the same people are seeing it again. It is not a new audience.
The metrics that matter most are engagement rate, saves, shares, click-through rate, and referral traffic. Each is hard to fake without real interest from your audience. Reach, impressions, likes, and follower count matter less. They can grow a lot without helping your business.
Check monthly, not daily. Single post results vary a lot due to timing and the algorithm. Checking daily just reacts to noise, not real patterns. A quick fifteen-minute review each month of your best and worst posts gives you almost all the insight you need.
They measure engagement against different bases. The same activity gives different percentages depending on whether you divide by followers, reach, or impressions. Samples also differ by industry and account size. Numbers for one platform can differ by more than ten times. Always check the base first.
Yes, but as context, not as goals. Reach, impressions, likes, and follower count show the conditions your content faced. They help you read the metrics that matter. The real mistake is reporting them as main results, or setting goals around numbers that can rise without helping your business.
Report referral traffic and conversions from tagged links, not platform metrics. Be honest that some credit gets lost. People often see a post, search the brand later, and arrive through another channel that gets the credit. So social stays undercounted. Treat your tracked number as a floor, not the full picture.
Endnote
Learning how to understand social media analytics means reading numbers in combination rather than chasing them one at a time. Once that shift happens, the dashboard stops feeling like a verdict and starts feeling like a set of clues you already know how to read.
Numbers only matter if the content was made with intention. A post with no clear goal won't earn attention, no matter how well you read the data. Graphic Design Eye LLC builds the actual assets your monthly review judges: post designs, carousels, and short-form videos. These will earn you saves, shares, and comments. Instead of generic templates, our team designs for each format's strengths.
A static image, a carousel, and a Reel all earn attention in different ways. Each needs its own approach. Every content package follows a clear campaign structure from the start. This makes it easy to trace results back to specific creative choices.
That is exactly where your next step lives. Pair your monthly fifteen-minute review with content actually designed to perform inside it. And Graphic Design Eye LLC can build those posts, videos, and campaigns so the numbers you are reading finally reflect work made to earn them.
If you are ready to stop guessing at what your analytics mean and start producing content, explore our social media design services or reach out directly. Our experts will be glad to read.
Read every number like it is trying to tell you something true, and hold none of them so tightly that you forget to make the next thing.
Graphic Design Eye LLC is a full-service creative agency built for brands that demand more than design — they demand vision. From strategic branding to complete visual identity, we partner with startups, agencies, and growing businesses as a dedicated creative force. With flexible subscription and project-based models. Let's start with us today!