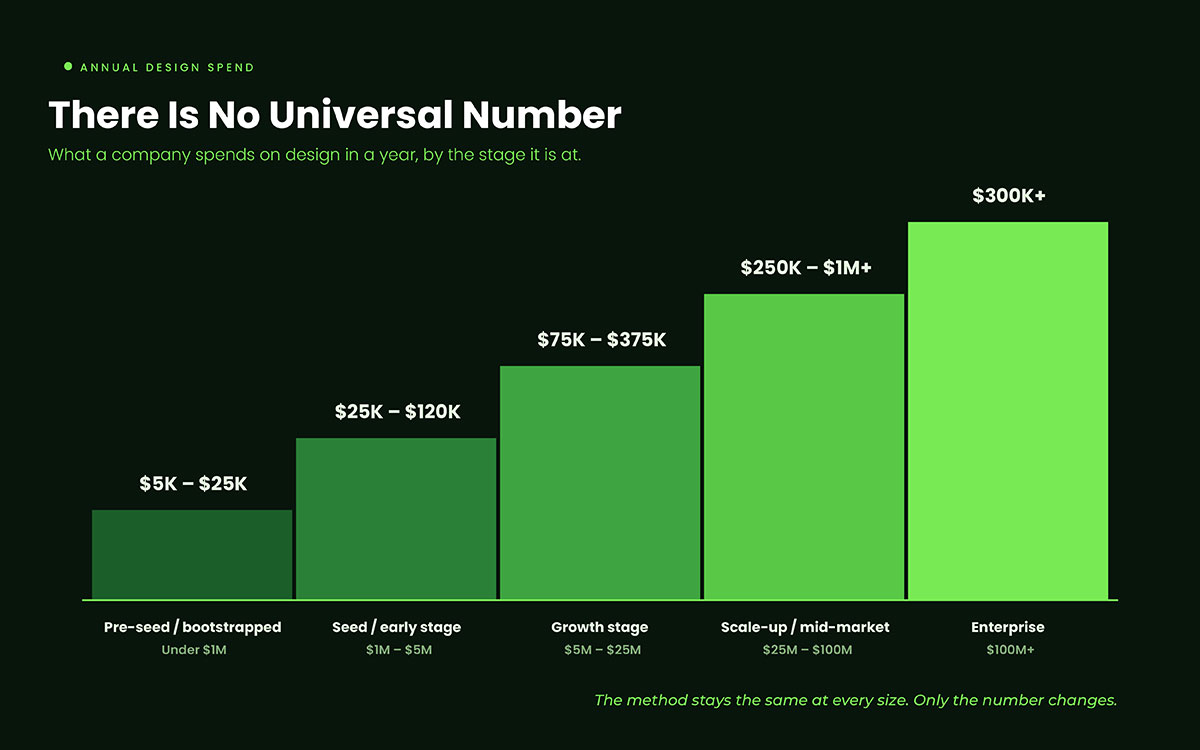
How to budget for graphic design depends on your company stage, not on a universal number. Pre-seed teams typically commit $5,000 to $25,000 in year one. Growth-stage companies run $75,000 to $375,000. Enterprises usually spend 5 to 10 percent of marketing. The method stays the same at every size. Check last year's spend, plan the year ahead, pick a delivery mix, keep a reserve, and track cost per asset once the plan starts.
Every finance calendar has a moment like this one.
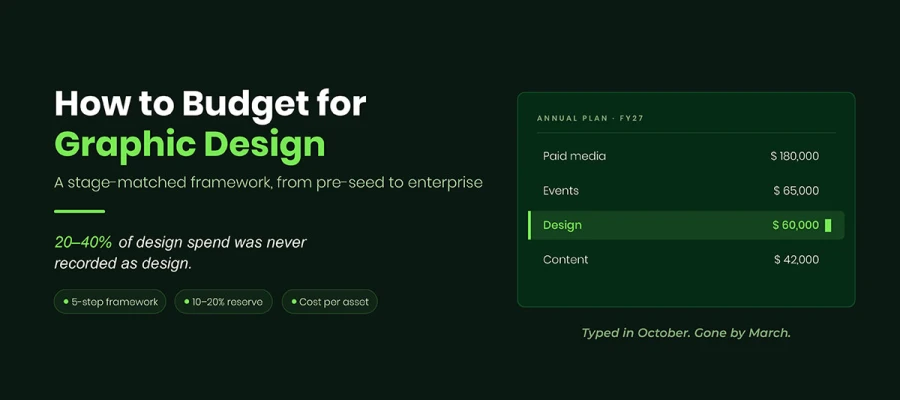
The annual plan is due Friday. Someone opens the spreadsheet, finds a single row labeled "design," and types a number that feels roughly right. Nobody argues. The plan gets approved.
Then the time arrives. A launch lands early. Three campaigns need resizing for four channels. A font license quietly expires. And that number which felt roughly right back in next month? Already gone.
Sound familiar, right? Don’t worry.
Here is a stage-by-stage guide to budgeting for graphic design based on the company's stage. You'll also get a five-step framework for building annual design budgeting and the seven budgeting mistakes that quietly ruin even a careful plan.
Ready to build a budget you can actually defend? Keep reading!
How to budget for graphic design
Knowing how to budget for graphic design requires knowing your company's stage. Revenue and asset volume determine whether a business should spend thousands or millions of dollars annually.
The breakdown below covers five growth phases with typical spend and delivery models. Find your stage before reading on.
Company stage
Revenue band
Typical annual design spend
Usual delivery model
Pre-seed / bootstrapped
Under $1M
$5,000-$25,000
One-off project plus templates
Seed / early stage
$1M to $5M
$25,000-$120,000
Freelance or fractional plus retainer
Growth stage
$5M to $25M
$75,000-$375,000
1 to 3 in-house plus retained partner
Scale-up / mid-market
$25M to $100M
$250,000-$1M+
In-house team plus tiered agency roster
Enterprise
$100M+
$300,000 to several million
Consolidated roster plus internal studio
Pre-seed and bootstrapped (under $1M revenue)
Most companies should plan $5,000 to $25,000 for design in year one.
You do not need a brand book yet.
You need an identity system that lasts for 2 years: a mark, a color set, 2 typefaces, and templates for Adobe or Figma. Your team should use them without help. A non-designer should make a social post, pitch slide, and one-pager alone.
Cut anything that may not survive a pivot. Custom illustration, packaging, motion graphics, and photo shoots can wait until product-market fit. They also cost less once you know your customers.
Protect work that keeps adding value. A focused brand identity engagement usually gives more value than many one-off assets.
WATCH ITEM
The highest hidden cost here is founder time. Spending six hours a week art directing isn't free. It's not a small cost either. Price it at your own opportunity cost before deciding a cheaper vendor saved you money.
Seed and early stage ($1M to $5M revenue)
Companies in this band usually spend $25,000 to $120,000 a year on design.
The work changes here. You're not just buying an identity anymore. You're buying output: sales materials, a website that converts, and campaign templates marketing can reuse without a new brief each time. Volume becomes the main thing you plan around.
Most teams settle on a fractional or freelance designer plus a small retainer for overflow work. A good threshold to test is 60-80 design hours per month. Below that, hiring means paying for idle time. Above it, freelance costs and coordination hassle start to beat a salary. Use that range to run your own numbers, not as a fixed rule. If it points to hiring, a structured hiring process keeps that costly decision from turning into a costly mistake.
Growth stage ($5M to $25M revenue)
Growth-stage companies usually spend $75,000 to $375,000 a year on design.
Consistency is now the costly problem. You have more channels than people, and each one wants its own version. The fix is systems: a design system with reusable parts, clear brand guidelines, and a digital asset platform. This way, nobody rebuilds something that already exists in someone's downloads folder.
This is also the time to track cost per asset. Your finance partner will eventually ask for this metric. Divide total design spend by assets shipped, then break it down by type. A landing page and a social tile are not the same unit. Channel benchmarks help too. Our breakdown of social media design costs gives you a comparison point for the highest-volume category most teams run.
The usual setup is one to three in-house designers plus a retained partner for spikes and special skills. Keep the partner on retainer, not project terms. At this stage, the value is guaranteed availability during launch week, not a lower per-unit price.
Scale-up and mid-market ($25M to $100M revenue)
Design budgets at this level usually run $250,000 to over $1M.
Governance becomes the hard part, not creation. You manage regional versions, translation, legal review, and a brand many people can touch. Production efficiency matters more than one great asset. Inconsistency finally shows up as a real cost.
Give design ops tools their own budget line, apart from people. This covers the DAM, workflow and approval software, a brand portal for partners and regional teams, and font and stock licenses. Physical production also gets costly here. Packaging design behaves differently from digital work, since every dieline change adds tooling and print costs.
Enterprise ($100M+ revenue)
Enterprise design spend usually runs $300,000 to several million. It's often 5 to 10 percent of the marketing budget.
Here the question changes. At this size, you're rarely buying more design. You're cutting duplication. Vendor consolidation, roster cuts, and scope renegotiation become the real tools. The numbers support this.
Gartner's 2025 CMO Spend Survey found 39 percent of CMOs planned to cut agency budgets. Their top tactics are dropping weak agency relationships, trimming rosters, and renegotiating contracts and scopes. The same survey found that 22 percent of CMOs said generative AI allowed them to rely less on outside agencies for creativity and strategy.
MODEL AI AS AN ASSUMPTION, NOT A SAVING
Generative tools move spending from production to direction and review. Someone must still brief, judge, correct, and approve. That person is usually your most expensive one. Budget the licenses as a real cost. Treat any headcount cut as a guess to test, not a savings to count on early.
5 Step annual graphic design budgeting framework
The process of knowing how to budget for graphic design follows five sequential steps, each taking only a few hours to complete. The process moves from auditing past spend to tracking present performance.
Work through each step below to build a number that survives contact with the year ahead.
Step 1: Audit last year’s actual design spend
Pull every invoice, not just the design ones. Contractor payments, software subscriptions, stock and font licenses, print and production costs, freelance top-ups on a campaign code, and the agency retainer.
Most teams find that 20 to 40 percent of marketing design spend was never logged as design. Everything else in your budget depends on this number. A forecast built on a wrong baseline is just dressed-up guesswork.
Step 2: Forecast asset demand for the next twelve months
Build an inventory before you build a budget.
List the campaigns, launches, events, sales materials, social posts, web pages, and packaging you already know are coming. Count the units. Then multiply volume by average unit cost. Count variants, not just originals. One campaign idea can turn into 15 deliverables once it spans 4 channels and 3 regions. If your inventory keeps missing things, check it against the main types of graphic design. This quickly shows work nobody planned for.
Step 3: Choose your delivery model mix
Volume decides the model. The model decides the cost structure.
Almost nobody runs one model well. The real answer is a mix. Weigh it toward the option that matches your steady volume. Add a second channel to absorb peaks.
Step 4: Allocate contingency and reserve
Hold 10 to 20 percent of the total unallocated.
This is not padding. It pays for rush jobs, rebrand overflow, and campaigns nobody could plan for next month. Gartner has noted that CMOs often face in-year budget cuts. A reserve absorbs that first cut without stopping committed work. A budget with no contingency is not lean. Every surprise becomes an overspend conversation.
Step 5: Set KPIs and a review cadence
A design budget only works if you check it against real results. Five key metrics show whether spending is efficient, whether capacity matches demand, and whether your forecast remained accurate over time.
The table below shows what each metric tracks and how often to check it.
Metric
What it tells you
Review cadence
Cost per asset
Whether your delivery mix is efficient
Quarterly, segmented by asset type
Turnaround time
Whether capacity matches demand
Monthly
Revision rounds per asset
Whether your briefs are good enough
Quarterly
Asset reuse rate
Whether your design system is working
Half year
Reserve drawdown
Whether your forecast was realistic
Quarterly
The five design budget KPIs worth tracking, and how often to check them.
Review every quarter and re-forecast at mid-year. Split the yearly total by quarter. Design demand is uneven. It follows your launch schedule, not the accounting calendar.
7 Graphic design budgeting mistakes to avoid
Most graphic design budgeting mistakes occur at companies of all sizes, regardless of their stage or revenue. It's always cheaper to prevent these mistakes than fix them later.
The seven common pitfalls below help you catch weak spots in your plan before they cause overspending.
Budgeting for creation but not adaptation. Resizes, translations, and channel versions often cost more than the original build. Plan for the whole family, not just the hero asset.
Ignoring license renewals and expiring rights. Font licenses, stock rights, and talent windows expire quietly. You find out the hard way, usually by legal email.
Running with no backup budget. Without a reserve, every urgent request becomes overspend. Every overspend becomes a negotiation.
Treating a rebrand as a small design task. A rebrand touches the whole company: signage, packaging, uniforms, legal, and every website. Scope it well, or it becomes a crisis. That's why rebranding strategy budgets stay separate from normal design work.
Assuming AI cuts costs automatically. AI tools save production time but add time for review and art direction. Skip that second part, and the savings disappear.
Timing your first in-house hire wrong. Hire too early, and you pay for idle time. Wait too long, and freelance work costs more than a salary.
Mixing one-off and recurring spend. Without splitting them, you can't tell if your budget is healthy. Last year's website rebuild might still be skewing the numbers.
THE ZERO-BASED ALTERNATIVE
If your annual design budget grew out of habit, try building next year's budget from scratch instead of adding a percentage to last year's.
Zero-based budgeting makes every category justify itself against expected asset needs. It's the fastest way to find spending that survives only because no one questions it.
Design budget planning FAQs
Still have a few things on your mind? You are not alone. As you learn how to budget for graphic design, you'll find it raises questions across nearly every planning cycle, from first-time founders to seasoned marketing leads. These answers cover cost benchmarks, hiring thresholds, and how to categorize spend correctly. Look at the questions below for direct answers to the most common questions. For any further queries, reach out to us anytime for a free consultation.
Most small businesses spend 10 to 20 percent of their marketing budget on graphic design. That's usually $10,000 to $50,000 a year. If marketing is 7 to 8 percent of revenue, design is near 1 to 1.6 percent of revenue for businesses under $5 million. These are rough guides, not real benchmarks.
Design usually takes 5 to 15 percent of a marketing budget. New companies spend more, since they're building their identity. Big companies spend less, since production is more organized across in-house teams and partners. Gartner's 2025 survey found agency spending near 21 percent of marketing budgets.
In-house is usually cheaper past about 80 design hours a month. The Bureau of Labor Statistics reported a median graphic designer wage of $61,300 in May 2024. With normal extra costs, that's about $77,000 to $86,000. Below that workload, freelance or retainer work avoids paying for unused time.
Check last year's real spending. Predict next year's asset needs. Price that against your delivery setup. Add a 10-20 percent buffer. Then set cost-per-asset and turnaround goals, and review them every quarter. Split the budget by quarter based on your launch schedule, not evenly.
Brand identity projects can cost a few thousand dollars or more than $100,000, depending on the scope and company size. Rebrands usually cost more than new identities. They need brand research, repositioning, and updates to every asset across every channel you use.
Design usually stays inside marketing, but should be tracked separately. Teams that hide design costs inside campaigns often underreport spending by 20 to 40 percent. That makes forecasting unreliable and weakens your position when negotiating with vendors.
Generative AI moves spending from production to direction and review. Gartner found 22 percent of CMOs said AI cut their need for outside agencies. Its 2026 survey found AI spending averages 15.3 percent of marketing budgets. Budget for licenses, but don't expect equal savings in headcount.
Cut new production first. Keep templates, your design system, and license renewals. These keep costs low. Delay custom illustration, motion, photography, and print. A 10-20% buffer can absorb a mid-year cut without stopping ongoing work.
Endnote
Finally, we're at the end of this article.
That was quite a session, right? Stages, frameworks, benchmarks, mistakes. So where does all this land in your spreadsheet?
Somewhere better than next month, hopefully.
Here's what our team keeps coming back to. The number you need is the row that matches your stage. That could be $5,000 to $25,000 in your first year. Or several million across a large enterprise roster. Adjust it with an asset forecast only you can build.
The method works for companies of all sizes. Audit what you actually spent. Forecast the work you already know is coming. Pick a delivery model that fits your volume, not your ambition. Hold back 10 to 20% for the year nobody can predict. Then measure cost per asset. That way next year's talk starts from evidence, not guesswork.
Five steps. One day of work. A plan that survives contact with next month.
That's the quiet advantage here. Teams that know how to budget for graphic design spend deliberately. And deliberate spending turns a design line into an asset. It stops being a recurring argument with finance. Don't you think so?
Your plan will change, of course. Every plan does. Revisit it at the half-year. Adjust the mix. Let that reserve do its job.
And if you'd like a second pair of eyes on the model or on the work it pays for, Graphic Design Eye LLC partners with founders and marketing teams at every stage above.
Time to open that spreadsheet! Soon we'll be back with another topic to help your business grow. Till then, stay planned and stay confident.
Graphic Design Eye LLC is a full-service creative agency built for brands that demand more than design — they demand vision. From strategic branding to complete visual identity, we partner with startups, agencies, and growing businesses as a dedicated creative force. With flexible subscription and project-based models. Let's start with us today!